Friday 27 October 2017

SEPON development post II

Social and Economic Pressure on Nature (SEPON) is fun! I'm enjoying the development of this index which will hopefully provide a guide to the pressure and utilisation of natural resources in just about any geographic area in Australia. In my introductory post I outlined some of the concepts that I would be adopting. This post is, however, mainly just an update and examples on some of the output of the SEPON model and a note on a couple of model tweaks.

First the tweaks. At very high resource pressures the model 'gave up'. There was little ability to differentiate at these high pressures. Essentially, the model could not determine whether a very high pressure was different from a moderately pressure. I've introduced a tweak in the index to slightly better resolve the higher end of the natural resource pressures essentially giving the model the ability to differentiate between 'Moderate', 'High' and 'Very High'. Interestingly, this change seems to have affected rural SEPON index values more than cities, pushing some scores up, especially due to the effect of transport pressures. For example Byron Shire Council which already had a relatively poor score of -9 actually turned out to be a -13. Walcha Shire Council had its value of 6 reduced to 2 (remember a ore positive value indicates an increased likelyhood that people are using natural resources of the area in a sustainable way and vice versa). What is a surprise is that people that live in Byron Shire Council and Sydney City now have equal scores. My gut feeling is that the effect of transport (D5) is too highly weighted in the model... I'll have to go through the assumptions again and double check. There might be another tweak needed.


Expanded Local Government area SEPON Index Values without NRU concept applied

Where matters!
An example I'd like to show is the difference in scores in two areas Armidale Regional Council and the Armidale ABS Statistical Area (SA2). The example on the right serves to demonstrate that the Armidale ABS statistical area has an apparently overall adverse pressure on natural resources, however, the whole local government area is apparently sustainable. I.e. The manner that people use natural resources in the rest of the LGA effectively 'subsidise' the Armidale ABS Statistical Area. This seems a fairly reasonable observation especially relating to the pressure on land resources (D1). Note that this model was run before aforementioned tweak was made for high pressures.

Also, I wanted to show what happens when I start applying preliminary aspects of the Natural Resource Utilisation (NRU) concept to the Armidale Regional Council and Armidale ABS Statistical Area. Unfortunately the selection of these regions is not necessarily very good with regard to illustrating NRU, a more built up area such as Sydney might illustrate the concept better. Essentially the scores were unchanged for those two areas... I think that the adjusted SEPON index value including NRU for Byron and Sydney LGAs might be a good one to run through. I speculate that this will make Byron LGA better than Sydney. but that will be a future post.


Saturday 7 October 2017

SEPON development post I

Socio-Economic Pressure on Nature (SEPON) is an index under development to provide a semi-quantitative method to estimate the likelihood an individual in a given location is having a negative or positive impact on Earth resources.

The present draft version of SEPON provides an index value of between -40 and +40. If a geographic area has a value of 0 a person living in that geographic area is 'likely' to have little impact on the long term environmental condition of the area. The higher positive number indicates an increased likelihood that a person living in that geographic area will have a net sustainability. Conversely a strongly negative value means that the impact of a person living in that area cannot be sustained overall by that geographic area (i.e. the 'footprint' of all the people living in that geographical area extends beyond the areas geographical boundaries).

Example output from SEPON for selected local governments.
The index uses various attributes from numerous sources that can be applied to specific geographic
areas. SEPON can be applied to small (e.g. suburban scale) or large areas (e.g. states) where consistent data is available across those areas. The draft index datasets is presently very NSW centric and includes Roads & Maritime Services vehicle data, Australian Bureau of Statistics population and dwelling data, Human Services negative income and long term transfer payment data, Office of Environment and Heritage landuse data and more.

The example provided shows the very minimalist output at this stage. The final line with the bold numbers is the SEPON index value. The example areas are local government areas and I think that they are somewhat intuitive when you consider the base information fed into SEPON. People in the Sydney City Council geographical area appear to generally have a footprint a fair bit greater than the actual geographical area. In other words Sydney City Council requires more natural resources to sustain it than it actually could ever sustain within its geographical area. The main reason for this is the arable land required to sustain the population and the nature of housing the population. Sydney City Council appears to be a net 'consumer' of natural resources.

Compare Sydney City to the Walcha Shire Council area. A lightly populated area in the New England tablelands, Walcha overall appears to be a net 'supplier' of natural resources. However, some factors such as transport generally has a relatively substantial negative natural resource impact and therefore the area doesn't have a very high positive value. Compare this with Byron Shire, which although predominately rural in nature has a very high demand of natural resources.

Surprisingly, and maybe anomalously, Fairfield Council has a near neutral SEPON index value. This seems to be particularly due to the manner in which transport is used, the manner in which the population is housed. I will need to return to the index to undertake some qualitative analysis to determine if this is reasonable or not for this local government area.

Let me know what you think in the comments section below.

Earth & Environmental Science services


As mentioned in my blog post from July, I have gone into the business world as a sole-trader. I'm pleased to be able to sampling and assessment services for people who require assistance with soil, water or waste management. This includes contaminated land investigations through to agronomic soil sampling for crop productivity. This blog post is entirely self serving, to let people know about my business.

Primary services and products
knowledge of the environmental road ahead for your business 
  • Soil, geological and vegetation mapping
  • Geological mapping and interpretation
  • Soil sampling and analysis services
  • Testing of water sources for potable, stock and irrigation use
  • Farm planning and farm mapping
  • Agronomic soil information for pasture and cropping productivity
  • Groundwater source planning
  • Project management 
  • Acid sulfate soils
Secondary services and products
  • Miscellaneous mapping and GIS exercises
  • Petrographic services
  • Genealogical research
  • Direct weed control
  • Groundwater modelling
For more information including an advertising flier please refer to my business page.

Wednesday 30 August 2017

The Big Scrub Rainforest: A Journey through time

This years Byron Writers Festival saw the release of several interesting looking books and I was excited to be part of one of those books. I have written the chapter about the geological history of the Big Scrub for the book The Big Scrub Rainforest: A Journey Through Time. The quality of the publication is excellent with wonderful artwork and interesting articles. The natural history of the region is covered in detail as well as some of the indigenous and recent cultural history. Contributing authors range from me to Rob Kooyman (Ecologist), Bob Brown (Environmentalist) and many many others.

The book has been a labour of love for the editor Shannon Greenfields, The Big Scrub Landcare Group, Rous County Council, Brookfarm and many others.


If you are interested in the book it can be obtained from the following locations:
  • Brunswick, Lismore or Byron Visitor Information Centre
  • Nimbin or Lismore Environment Centres
  • Mary Ryan’s Bookshop Byron Bay
  • Mullumbimby Bookshop
  • The Book Warehouse, Lismore. 
***Phone Orders – please contact The Book Warehouse Lismore to place your order (they will post them to you) 02 6210 4204.***

Sunday 16 July 2017

Rockvale Arsenic mine


Rockvale Monzogranite and my toes for scale
It has been a long time since I wrote a blog post. Life has got in the way with a unexpected sorrow in the death of my little lady. It has been a year of change and that includes work and new ventures. Now, I begin the journey of working for myself. In saying that, if you have any work that might interest me I’d love to chat to you about it. I don’t have a web page at this stage, but I have my contact details on this page. Already, I have had the opportunity to work in the North Coast again, renewing old and making new contacts. I am still based in the New England area and as always it is an adventure to explore the land and environment.

The first post I want to do is one about an arsenic mine I visited near Armidale. When I visited the Rockvale Arsenic Mine it was quite evident that the site has contaminated the soil. The most widespread contaminant in the region is antimony metal which when mined (along with gold) in the Hillgrove district and was discharged in large volumes into the Macleay River catchment. This antimony continues to be dissolved in water flowing from the old Hillgrove and other abandoned areas. However, further upstream from Hillgrove, in the Wollomombi River catchment from is Rockvale which has a similar geological history.

Rockvale Arsenic mine
Possible evidence of contaminated soil transport (gully erosion)
Rockvale is named for its rocks! Granite types that cover a very large area. The rock unit is called the Rockvale Monzogranite of the Hillgrove Supersuite. It was formerly known as the Rockvale Adamellite, in the old nomenclature. According to Kent (1994) the Rockvale Monzogranite consists of 20 individual plutons all intruded during the Carboniferous (at approximately 303Ma). The surrounding rock into which it intruded and metamorphosed the Girrakool Beds. The metamorphic effects are quite significant and extend for quite some distance from the Rockvale Monzogranite. Interestingly, there are many hydrothermal mineral deposits in the Rockvale Monzogranite and adjacent metamorphic rocks, yet the mineral deposits were formed 50Ma later (approximately 250Ma). This situation is similar to the nearby Hillgrove mines which although spatially appear to be directly related to the Hillgrove Monzogranite but are actually later concentrations of hydrothermal minerals.

The number of old mines is the Rockvale area is quite significant. Some have been rehabilitated, some badly rehabilitated and others still discharge metal contaminants into the receiving environment. The Rockvale Arsenic mine is a good example, it appears to be the northern most of several mineral deposits that occur along a line a couple of kilometres long, possibly terminating at the Ruby Silver Mine. The main mineral mined from the hillgrove arsenic mine was arsenopyrite, though other less common arsenic minerals were also part of the ore. The arsenic was 'roasted' to drive of volatile elements and concentrate the ore.

The legacy of historical operations can be seen from the photograph which shows extensive bare areas and gully erosion due to the metal toxicity and acid mine waste from oxidised pyrite, arsenopyrite and other sulfide minerals. So, although the metal contamination from downstream Hillgrove is well known, a baseline study will obviously provide some indication that contamination is coming from other upstream sources too. It will be interesting to see how much.

References/bibliography

*Ashley, P. & Graham, B. 2001. Heavy metal loadings of streams in the Macley River catchment. Report to the Mid North Coast Catchment Management Board, NSW Department of Mineral Resouces & Armidale Dumaresq Council.
*Craw, D., Wilson, N. & Ashley, P.M. 2004. Geochemical controls on the environmental mobility of Sb and As at mesothermal antimony and gold deposits. Applied Earth Sciences (Transactions of the Institute of Mining and Metallurgy) vol 133 B3.
*Kent, A.J.R. (1994) Geochronology and geochemistry of Palaeozoic intrusive rocks in the Rockvale region, southern New England Orogen, New South Wales. Australian Journal of Earth Sciences 14:4
*McClatchie & Sylvester. 1970. The Tulloch Silver mine. Records of the Geological Survey of New South Wales. Vol 12, part 1.


Thursday 9 March 2017

Where you are: GDA2020 on the way

Australia's main datum for mapping and locating points on the australian continent is changing. You can occasionally find old maps using AGD66 in some shops, these are out of date. In 2000 GDA94 was adopted and now it too is changing. GDA2020 is here! Have no idea what I'm talking about?

Here is a good video that explains the change:

https://vimeo.com/191566518

While I'm on spatial data... why not increase the accuracy of your GPS? Many new GPS units have a WAAS option. Enable this and you will have greater accuracy in all three spatial dimensions. Of course it only works when certain satellites are visible to your GPS, in northern Australia it will detect the Indian and Japanese satellite systems but in Victoria and Tasmania you may find it harder to find a satellite that has WAAS type capabilities.

Want to know more about WAAS:

https://www.youtube.com/watch?v=CeIEs9l9aws

Saturday 28 January 2017

Stunning in Red and White

A friend and colleague showed me his new lifestyle property on the edge of Armidale a couple of weeks ago. He is an observant soil scientist and noted that his land consisted of poor quality soils which grew only resilient grasses and some typical New England gum, stringy-bark and box woodland. He was curious about the rocks that were common on the surface of the dusty grey-brown soil. I was not surprised of the poor soils because the property is located on a geological unit called the Sandon Beds.

The Sandon Beds are common in the Armidale district, especially just to the north of the town. They were laid down sometime during the Devonian to Carboniferous periods. The rocks of the Sandon Beds are varied and include mudstones, conglomerates, volcanics and bio-chemical sedimentary rocks. The deposition of the unit was in the ocean debris flows from the continental shelf would form turbidites (coarse to fine grained repeating sequences), layers of fine mud would accumulate and occasional basalt volcanic rocks would occur. Sometimes, while a long distance from landmasses or spreading ridges very little would happen - only the gentle settling of dead primitive ocean organisms with silica skeletons.
Brecciated Jasper (chert) of the Sandon Beds

The settling of silica on the sea bed produces a rock called chert. It is common in the Sandon Beds with a red colour. The chert occurs in beds interspersed with dull mudstones, siltstones and the like. Possibly because of regional scale metamorphism or the effect of fluids in the rock the chert has been affected and displays its red colour. Because of the red colour it is often referred to as Jasper which is seen by some as a semi-precious stone.

Throughout my friend's property could be traced lines of chert running essentially north-south. This is because the beds have been tilted to a nearly vertical direction. There was nothing out of the ordinary with these beds but in one area some of the red chert caught my eye. I could not see the actual outcrop but scattered around one little area was red chert with bright white quartz veins. The chert had been broken apart and re-cemented together with the quartz rich fluid. The result was quite striking, a stunning red and white. In this one little area, at some time after the chert had formed and turned into hard rock it had been blasted apart apparently by hot fluids. A 'brecciated jasper' occurring in a little area that just happened to be on a friends new property just ready to be discovered.

Monday 16 January 2017

Blog Update #11 - More rocks in our region

Not a lot to mention as far as the blog goes at this point, except that I've added photographs of three more stratigraphic units to the Rocks of the Region page. These are three of the many 'granites' in the Armidale district:

Gara Monzogranite --- Fickr Photos --- Stratigraphic Names Database
Glenburnie Leucomonzogranite --- Flickr Photos --- Stratigraphic Names Database; and
Rockvale Monzogranite --- Flickr Photos --- Stratigraphic Names Database
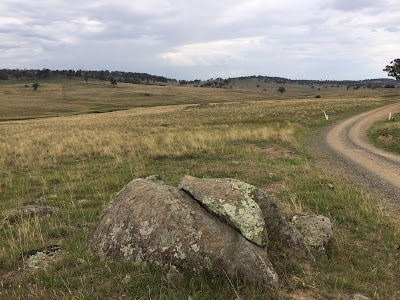
Typical landscape and outcrop characteristics of the Rockvale Monzogranite, Wollomombi area

On another note, while visiting a friends property near Armidale I observed a brecciated jasper in the Sandon Beds. I was aware of an abundance of jasper beds (red chert) in the region ever since my university days, however, I'd never seen a brecciated type and this was quite attractive. More to come in a week or so.